Makeover Monday is a social data visualization project that started within the Tableau community. Over the past 2 years, I have participated in many of the weekly challenges to rework a given chart and dataset. Although I’ve been inactive for several months, I’m taking the new year as an opportunity to get back into completing #MakeoverMonday on a regular basis—but with a new twist. I’m going to use Google Data Studio!
I have become enamoured with Data Studio over the past year for, among other things, the ease with which it lets you connect to data, create visualizations, and share them with others. Of course, it still lacks many of the powerful features that Tableau possesses for data transformation and analysis. But I think there are many aspects where Data Studio comes out ahead. For instance, Data Studio’s drag-and-drop dashboard canvas makes Tableau’s layout containers look archaic.
Datasets for Makeover Monday are usually posted in XLS or CSV format, in addition to TDE files for Tableau. For 2018 however, all the datasets are being hosted on the data.world platform. This will make it easier for users of other tools to participate in Makeover Monday through the integrations available with data.world. For Data Studio, you can connect directly to the data using the data.world Community Connector.
Connecting to data.world in Data Studio
- Open the data.world project for the dataset.
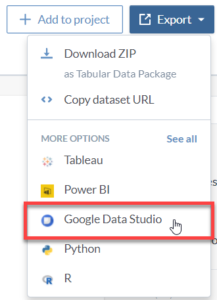
- Click the “Export” button and select “Google Data Studio”:
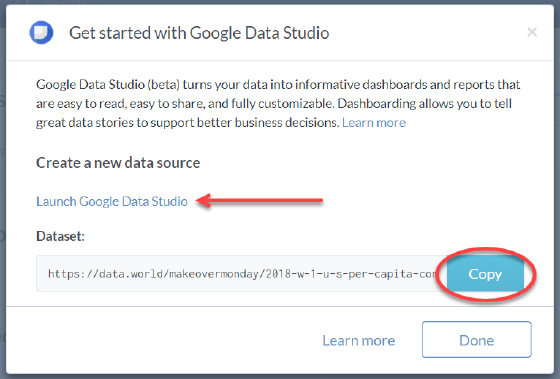
- Click to “Copy” the dataset URL. Then click “Launch Google Data Studio”:
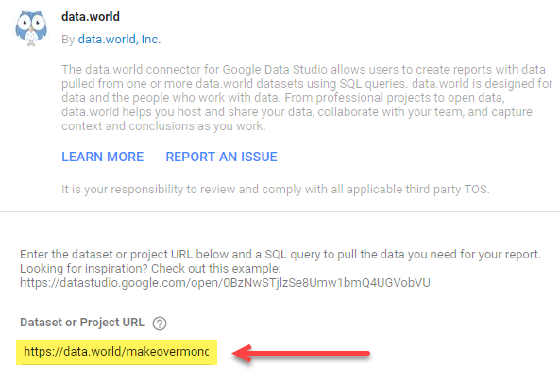
- Paste the dataset URL into the “Dataset or Project URL” field:
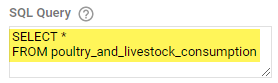
- Enter a SQL query to select your data. For example:
- Click the Connect button at the top right.
- Create your viz!