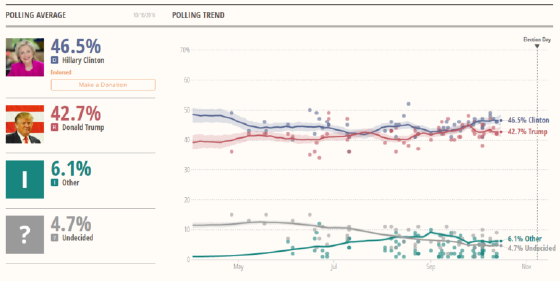
This week’s #MakeoverMonday viz takes a look at polling results in each state leading up to the U.S. Presidential election. The original viz is this interactive “Votamatic” tool at Daily Kos.

This is honestly an awesome visualization. The filter allows you to view the results for each state individually. And the interactive chart lets you hover and view the polling numbers at any point during the race.
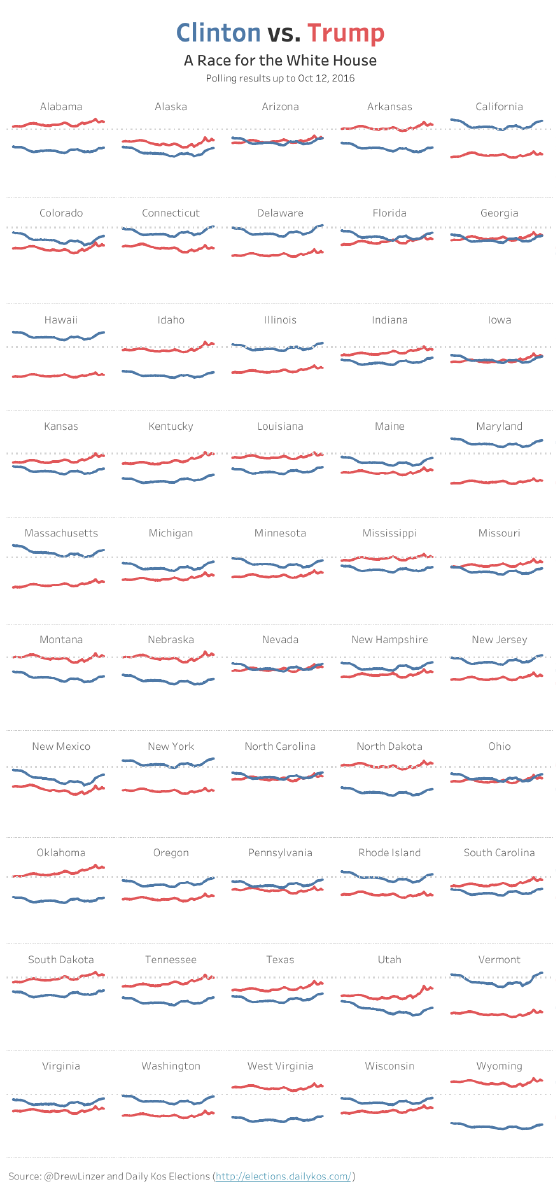
So, I decided to look at the data in a slightly different way.
Here’s my Tableau #ElectionViz:
