The subject of this week’s Makeover Monday is a pair of pie charts displaying employment data from the G7. The chart is used in an article on Business Insider, but the original source is a report by the White House Council of Economic Advisers.
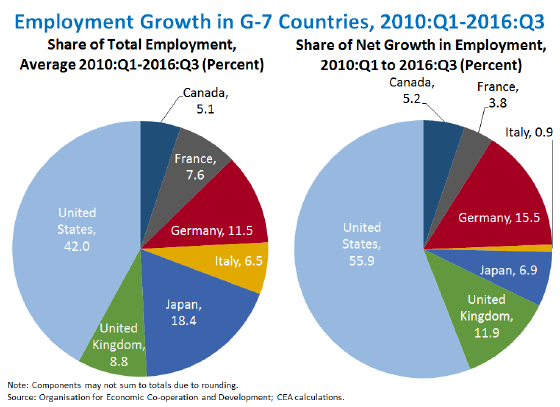
These charts are used to support the conclusion that the United States has been responsible for a disproportionate share of employment growth in the G7. Since 2010, the US has generated 55% of net employment growth, although it accounts for about 42% of total G7 employment.
What works well?
- Pies show the composition of the whole, which is appropriate given that we’re dealing in percentages
- Each country is given the same colour in both charts
- Numerical labels make comparison easier, rather than having to compare the size of each wedge
What could be improved?
- The pies prioritize showing the composition of the whole, but the focus of the analysis is on the comparison between the measures
- The slices of the pie are ordered alphabetically; Sorting by size would make it easier to see how the countries rank relative to each other
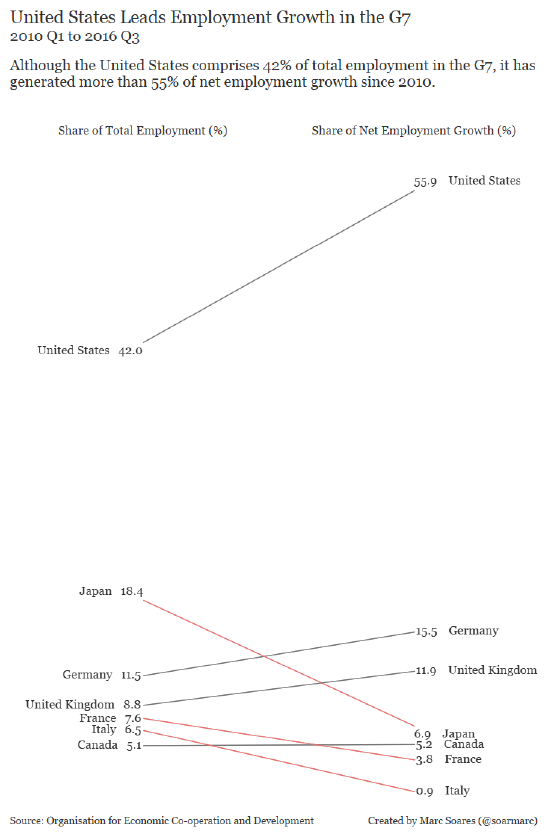
I decided to take a minimalist approach to my #MakeoverMonday viz and represent this data with a slope graph. I was inspired by the work of Edward Tufte, who is credited with inventing the slope graph. I also aimed to maximize the data-ink ratio—a principle championed by Tufte—by eliminating non-data ink. Here is the result: